(시계열) apple_stock_exercises
Apple Stock
Introduction:
We are going to use Apple’s stock price.
Step 1. Import the necessary libraries
import pandas as pd
import numpy as np
import matplotlib.pyplot as plt
Step 2. Import the dataset from this address
pd.read_csv("https://raw.githubusercontent.com/guipsamora/pandas_exercises/master/09_Time_Series/Apple_Stock/appl_1980_2014.csv")
| Date | Open | High | Low | Close | Volume | Adj Close | |
|---|---|---|---|---|---|---|---|
| 0 | 2014-07-08 | 96.27 | 96.80 | 93.92 | 95.35 | 65130000 | 95.35 |
| 1 | 2014-07-07 | 94.14 | 95.99 | 94.10 | 95.97 | 56305400 | 95.97 |
| 2 | 2014-07-03 | 93.67 | 94.10 | 93.20 | 94.03 | 22891800 | 94.03 |
| 3 | 2014-07-02 | 93.87 | 94.06 | 93.09 | 93.48 | 28420900 | 93.48 |
| 4 | 2014-07-01 | 93.52 | 94.07 | 93.13 | 93.52 | 38170200 | 93.52 |
| ... | ... | ... | ... | ... | ... | ... | ... |
| 8460 | 1980-12-18 | 26.63 | 26.75 | 26.63 | 26.63 | 18362400 | 0.41 |
| 8461 | 1980-12-17 | 25.87 | 26.00 | 25.87 | 25.87 | 21610400 | 0.40 |
| 8462 | 1980-12-16 | 25.37 | 25.37 | 25.25 | 25.25 | 26432000 | 0.39 |
| 8463 | 1980-12-15 | 27.38 | 27.38 | 27.25 | 27.25 | 43971200 | 0.42 |
| 8464 | 1980-12-12 | 28.75 | 28.87 | 28.75 | 28.75 | 117258400 | 0.45 |
8465 rows × 7 columns
Step 3. Assign it to a variable apple
apple = pd.read_csv("https://raw.githubusercontent.com/guipsamora/pandas_exercises/master/09_Time_Series/Apple_Stock/appl_1980_2014.csv")
Step 4. Check out the type of the columns
apple.dtypes
Date          object
Open         float64
High         float64
Low          float64
Close        float64
Volume         int64
Adj Close    float64
dtype: object
Step 5. Transform the Date column as a datetime type
apple.Date = pd.to_datetime(apple.Date)
apple.dtypes
Date         datetime64[ns]
Open                float64
High                float64
Low                 float64
Close               float64
Volume                int64
Adj Close           float64
dtype: object
Step 6. Set the date as the index
apple = apple.set_index("Date")
apple
| Open | High | Low | Close | Volume | Adj Close | |
|---|---|---|---|---|---|---|
| Date | ||||||
| 2014-07-08 | 96.27 | 96.80 | 93.92 | 95.35 | 65130000 | 95.35 |
| 2014-07-07 | 94.14 | 95.99 | 94.10 | 95.97 | 56305400 | 95.97 |
| 2014-07-03 | 93.67 | 94.10 | 93.20 | 94.03 | 22891800 | 94.03 |
| 2014-07-02 | 93.87 | 94.06 | 93.09 | 93.48 | 28420900 | 93.48 |
| 2014-07-01 | 93.52 | 94.07 | 93.13 | 93.52 | 38170200 | 93.52 |
| ... | ... | ... | ... | ... | ... | ... |
| 1980-12-18 | 26.63 | 26.75 | 26.63 | 26.63 | 18362400 | 0.41 |
| 1980-12-17 | 25.87 | 26.00 | 25.87 | 25.87 | 21610400 | 0.40 |
| 1980-12-16 | 25.37 | 25.37 | 25.25 | 25.25 | 26432000 | 0.39 |
| 1980-12-15 | 27.38 | 27.38 | 27.25 | 27.25 | 43971200 | 0.42 |
| 1980-12-12 | 28.75 | 28.87 | 28.75 | 28.75 | 117258400 | 0.45 |
8465 rows × 6 columns
Step 7. Is there any duplicate dates?
dup = apple[apple.index.duplicated]
if len(dup) != 0:
    print("Yes, there are duplicate dates.")
else:
    print("No, there are no duplicate dates.")
No, there are no duplicate dates.
Step 8. Ops…it seems the index is from the most recent date. Make the first entry the oldest date.
apple = apple.sort_values(by="Date", ascending=True)
apple
| Open | High | Low | Close | Volume | Adj Close | |
|---|---|---|---|---|---|---|
| Date | ||||||
| 1980-12-12 | 28.75 | 28.87 | 28.75 | 28.75 | 117258400 | 0.45 |
| 1980-12-15 | 27.38 | 27.38 | 27.25 | 27.25 | 43971200 | 0.42 |
| 1980-12-16 | 25.37 | 25.37 | 25.25 | 25.25 | 26432000 | 0.39 |
| 1980-12-17 | 25.87 | 26.00 | 25.87 | 25.87 | 21610400 | 0.40 |
| 1980-12-18 | 26.63 | 26.75 | 26.63 | 26.63 | 18362400 | 0.41 |
| ... | ... | ... | ... | ... | ... | ... |
| 2014-07-01 | 93.52 | 94.07 | 93.13 | 93.52 | 38170200 | 93.52 |
| 2014-07-02 | 93.87 | 94.06 | 93.09 | 93.48 | 28420900 | 93.48 |
| 2014-07-03 | 93.67 | 94.10 | 93.20 | 94.03 | 22891800 | 94.03 |
| 2014-07-07 | 94.14 | 95.99 | 94.10 | 95.97 | 56305400 | 95.97 |
| 2014-07-08 | 96.27 | 96.80 | 93.92 | 95.35 | 65130000 | 95.35 |
8465 rows × 6 columns
Step 9. Get the last business day of each month
apple_month = apple.resample("BM").mean()
apple_month
| Open | High | Low | Close | Volume | Adj Close | |
|---|---|---|---|---|---|---|
| Date | ||||||
| 1980-12-31 | 30.481538 | 30.567692 | 30.443077 | 30.443077 | 2.586252e+07 | 0.473077 |
| 1981-01-30 | 31.754762 | 31.826667 | 31.654762 | 31.654762 | 7.249867e+06 | 0.493810 |
| 1981-02-27 | 26.480000 | 26.572105 | 26.407895 | 26.407895 | 4.231832e+06 | 0.411053 |
| 1981-03-31 | 24.937727 | 25.016818 | 24.836364 | 24.836364 | 7.962691e+06 | 0.387727 |
| 1981-04-30 | 27.286667 | 27.368095 | 27.227143 | 27.227143 | 6.392000e+06 | 0.423333 |
| ... | ... | ... | ... | ... | ... | ... |
| 2014-03-31 | 533.593333 | 536.453810 | 530.070952 | 533.214286 | 5.954403e+07 | 75.750000 |
| 2014-04-30 | 540.081905 | 544.349048 | 536.262381 | 541.074286 | 7.660787e+07 | 76.867143 |
| 2014-05-30 | 601.301905 | 606.372857 | 598.332857 | 603.195714 | 6.828177e+07 | 86.058571 |
| 2014-06-30 | 222.360000 | 224.084286 | 220.735714 | 222.658095 | 5.745506e+07 | 91.885714 |
| 2014-07-31 | 94.294000 | 95.004000 | 93.488000 | 94.470000 | 4.218366e+07 | 94.470000 |
404 rows × 6 columns
Step 10. What is the difference in days between the first day and the oldest
diff = apple.index.max() - apple.index.min()
diff.days
12261
Step 11. How many months in the data we have?
apple_month = apple.resample("BM").mean()
len(apple_month.index)
404
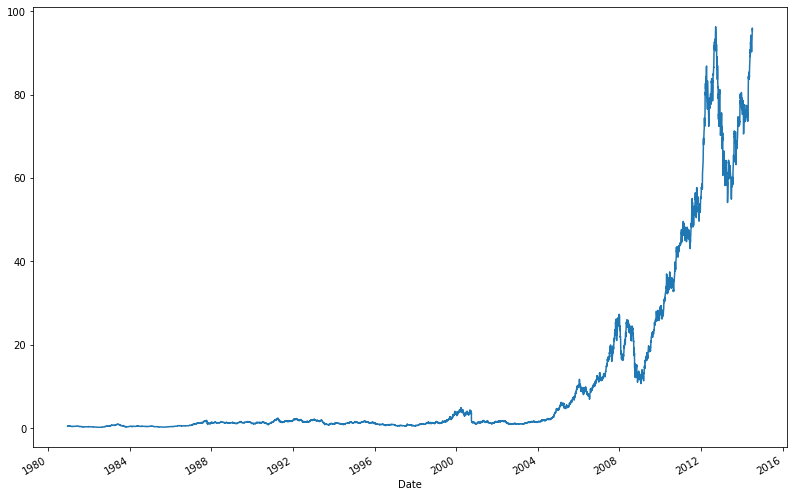
Step 12. Plot the ‘Adj Close’ value. Set the size of the figure to 13.5 x 9 inches
data = apple['Adj Close'].plot()
fig = data.get_figure()
fig.set_size_inches(13.5, 9)
BONUS: Create your own question and answer it.
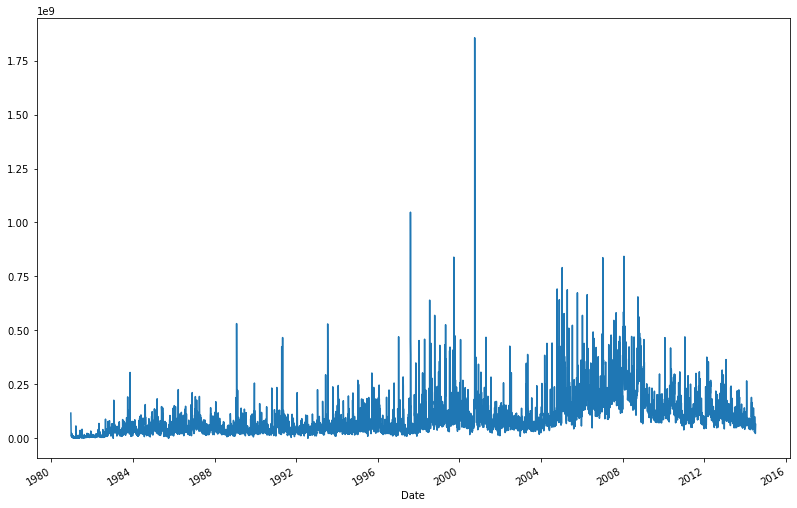
Plot the total ‘volume’ of Apple Stock being traded each day. Set the size of the figure to 13.5 x 9 inches
data2 = apple['Volume'].plot()
fig = data2.get_figure()
fig.set_size_inches(13.5, 9)
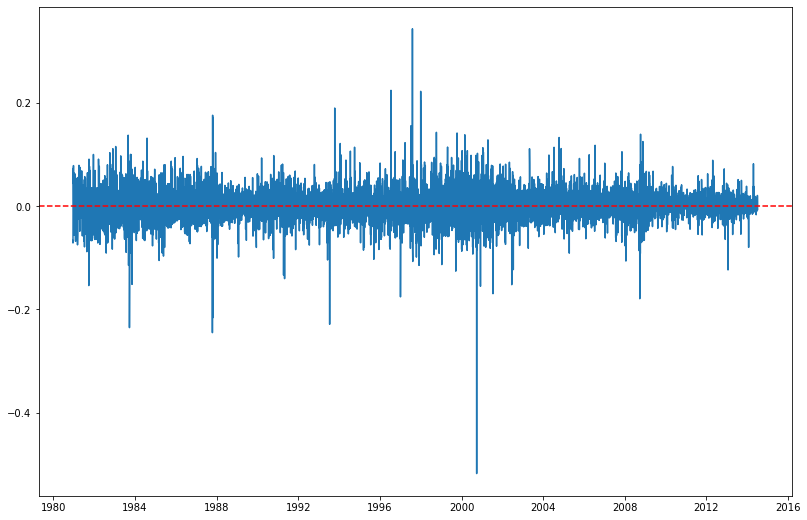
Plot the price-earnings ratio each day. Set the size of the figure to 13.5 x 9 inches
apple['Price_lag_1'] = apple['Adj Close'].shift(-1)
apple['Price_diff_1'] = apple['Price_lag_1'] - apple['Adj Close']
apple['Daily_return'] = apple['Price_diff_1'] / apple['Adj Close']
apple['Updown'] = [1 if apple['Daily_return'].loc[Date] > 0 else 0 for Date in apple.index]

apple_chart = apple[['Adj Close','Price_lag_1','Price_diff_1','Daily_return','Updown']]
apple_chart.head()
| Adj Close | Price_lag_1 | Price_diff_1 | Daily_return | Updown | |
|---|---|---|---|---|---|
| Date | |||||
| 1980-12-12 | 0.45 | 0.42 | -0.03 | -0.066667 | 0 |
| 1980-12-15 | 0.42 | 0.39 | -0.03 | -0.071429 | 0 |
| 1980-12-16 | 0.39 | 0.40 | 0.01 | 0.025641 | 1 |
| 1980-12-17 | 0.40 | 0.41 | 0.01 | 0.025000 | 1 |
| 1980-12-18 | 0.41 | 0.44 | 0.03 | 0.073171 | 1 |
apple['Updown'].value_counts() #주가 상승일(1), 하락일(0)의 수
0    4744
1    3721
Name: Updown, dtype: int64
plt.figure(figsize=(13.5, 9))
plt.plot(apple.index, apple['Daily_return'])
plt.axhline(y=0, color='red', ls='--')
plt.show() #일일 주가 수익률 그래프