(판다스 시각화) 왕좌의 게임 데이터 분석
데이터 시각화 (Matplotlib) 활용과 왕좌의 게임 데이터 분석
import pandas as pd
import numpy as np
from pandas import Series, DataFrame
1. matplotlib 간단 실습
1.1 하나의 그래프 그리기
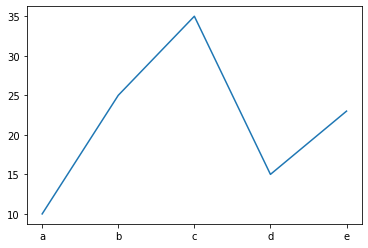
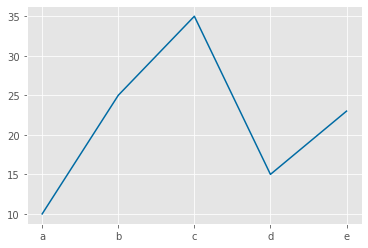
1.1.1 line graph 그리기
from pandas import Series
import matplotlib.pyplot as plt
sr = Series([10, 25, 35, 15, 23], index = ['a', 'b', 'c', 'd', 'e'])
sr
a    10
b    25
c    35
d    15
e    23
dtype: int64
plt.plot(sr)

fig, ax = plt.subplots()
ax.plot(sr)
[<matplotlib.lines.Line2D at 0x1915daf8d30>]

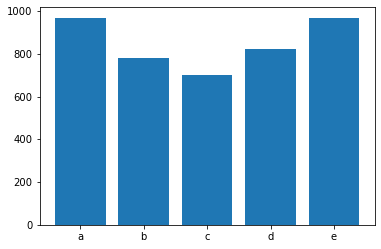
1.1.2 bar graph 그리기
import random
sr2 = Series(random.sample(range(100, 1000), 5), index=['a', 'b', 'c', 'd', 'e'])
plt.bar(sr2.index, sr2.values)
<BarContainer object of 5 artists>
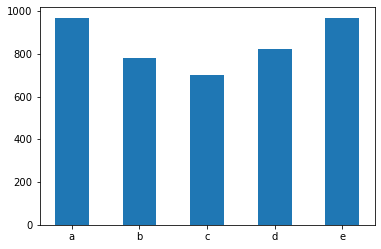
plt.bar(sr2.index, sr2.values, width=0.5)
<BarContainer object of 5 artists>
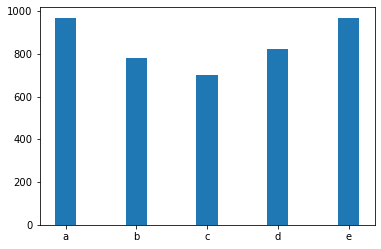
plt.bar(sr2.index, sr2.values, width=0.3)
<BarContainer object of 5 artists>
sr2.plot()
<matplotlib.axes._subplots.AxesSubplot at 0x1915dcfc730>
.png)
sr2.plot(kind = 'bar')
<matplotlib.axes._subplots.AxesSubplot at 0x1915dd751f0>

1.1.3 두 개의 그래프를 하나로 그리기
- <a href = https://matplotlib.org/3.1.0/api/_as_gen/matplotlib.pyplot.subplots.html> plt.subplots() </a> 함수는 새로운 figure와 axes(subplots)를 생성해 준다.
fig, ax = plt.subplots()
ax.plot(sr, color = 'r')
ax.bar(sr2.index, sr2.values)
<BarContainer object of 5 artists>
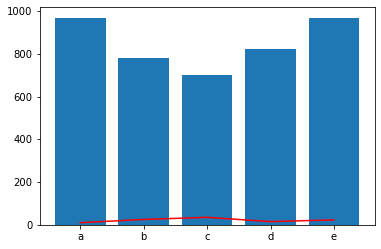
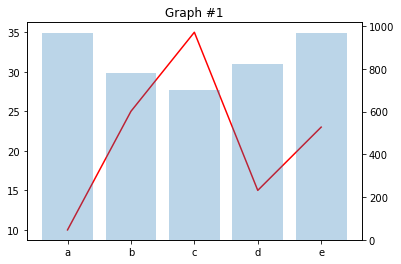
1.1.4 두 개 그래프를 서로 다른 y축 적용하기
fig, ax = plt.subplots()
ax.plot(sr, color = 'r')
ax2 = ax.twinx()
ax2.bar(sr2.index, sr2.values, alpha = 0.3)

#그래프 제목 부여 = 'Graph #1'
ax.set_title('Graph #1')
Text(0.5, 1.0, 'Graph #1')
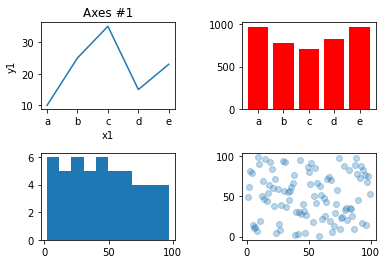
1.2. 여러 개 그래프 그리기
하나의 figure 안에 여러 개의 axes를 그리기
fig, ax_list = plt.subplots(2, 2)
ax_list[0,0].plot(sr)
ax_list[0,0].set_title('Axes #1')
ax_list[0,0].set_xlabel('x1')
ax_list[0,0].set_ylabel('y1')

ax_list[0,1].bar(sr2.index, sr2.values, color='r')
ax_list[1,0].hist(random.sample(range(1,100), 50))
ax_list[1,1].scatter(random.sample(range(1,100), 99),random.sample(range(1,100), 99), alpha=0.3)

fig.subplots_adjust(hspace=0.5, wspace=0.5)
# plt.subplots_adjust(hspace=0.5, wspace=0.5)
1.3. <a href = https://matplotlib.org/3.1.1/tutorials/introductory/usage.html#what-is-a-backend> backend </a> 개념
Matplotlib은 매우 다양한 usecase에 사용되며, 이를 모두 충족시키기 위하여 다양한 backend를 지원함.
가장 많이 활용하는 옵션은 inline으로, 그래프를 output창에 바로 표현되도록 하는 옵션이며, %maptlotlib inline를 실행하여 설정한다.
%로 시작하는 명령어는 Cell Magic 명령어로써, 파이썬 코드가 아니라 Jupyter에게 특정 기능을 수행하도록 하는 명령이다. 즉, %matplotlib inline 명령은 Jupyter에게 matplotlib 그래프를 출력 영역에 표시할 것을 지시하는 명령이다.
%matplotlib nbagg
fig, ax = plt.subplots()
ax.plot(sr)
<IPython.core.display.Javascript object>

[<matplotlib.lines.Line2D at 0x1915efbdb20>]
만약 그래프를 생성한 이후, interactive하게 그래프를 다루고 싶은 경우에는 backend를 interactive backend로 설정하면 된다.
예를 들어, %matplotlib nbagg를 실행하여 nbagg으로 설정을 변경할 수 있다.
보다 다양한 설정 옵션을 확인하려면 <a href = https://matplotlib.org/3.1.1/tutorials/introductory/usage.html#what-is-a-backend> 여기 </a>를 참고하면 된다.
아래와 같이 nbagg로 설정한 후, 그래프를 생성하면 output 창에 몇몇 버튼과 함께 그래프가 그려진다.
버튼들을 활용하여 zoon-in, zoom-out이 가능하다.
그래프를 그린 이후, set_title(), set_xlabel() 함수를 수행하면 현재 그래프에 적용되는 것을 확인할 수 있으며, 오른쪽 상단에 있는 파란색 버튼을 클릭하면 interactive 모드가 종료된다.
ax.set_title('Axes #1')
Text(0.5, 1.0, 'Axes #1')
ax.bar(sr2.index, sr2.values, color='r', alpha=0.5)
<BarContainer object of 5 artists>
1.4 <a href = https://matplotlib.org/users/customizing.html> matplotlib 설정 변경</a>
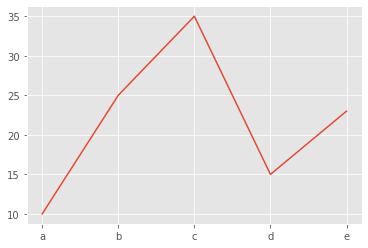
1.4.1 stylesheet 변경
matplotlib을 통해 데이터 시각화할 때 적용되는 스타일을 변경 가능하며, 사용가능한 스타일시트 목록 및 샘플은 <a href= https://matplotlib.org/3.1.1/gallery/style_sheets/style_sheets_reference.html> 여기 </a>에서 확인 가능하다.
plt.style.available
['Solarize_Light2',
 '_classic_test_patch',
 'bmh',
 'classic',
 'dark_background',
 'fast',
 'fivethirtyeight',
 'ggplot',
 'grayscale',
 'seaborn',
 'seaborn-bright',
 'seaborn-colorblind',
 'seaborn-dark',
 'seaborn-dark-palette',
 'seaborn-darkgrid',
 'seaborn-deep',
 'seaborn-muted',
 'seaborn-notebook',
 'seaborn-paper',
 'seaborn-pastel',
 'seaborn-poster',
 'seaborn-talk',
 'seaborn-ticks',
 'seaborn-white',
 'seaborn-whitegrid',
 'tableau-colorblind10']
%matplotlib inline
plt.style.use('ggplot')
plt.plot(sr)
[<matplotlib.lines.Line2D at 0x1915f4c08e0>]
plt.style.use('tableau-colorblind10')
plt.plot(sr)
[<matplotlib.lines.Line2D at 0x1915f50fe80>]
plt.style.use('seaborn')
plt.plot(sr)
[<matplotlib.lines.Line2D at 0x1915f55df40>]
.png)
1.4.2 matplotlibrc 파일 수정을 통한 파라미터 수정
- matplotlibrc 파일을 통해 figure 크기, axes의 폰트사이즈, 색상, 스타일 등 matplotlib의 모든 속성(property)들을 설정 가능하다.
- 파일을 변경한 후 저장하면, 이후에는 변경된 설정이 계속 사용된다.
- matplotlibrc 파일을 수정한 후에는 jupyter notebook을 재시작해야 수정 내용이 반영된다.
matplotlibrc 파일의 위치를 찾으려면 matplotlib.matplot.lib_fname()를 수행하면 된다.
import matplotlib
matplotlib.matplotlib_fname()
'C:\\Users\\chom5\\anaconda3\\lib\\site-packages\\matplotlib\\mpl-data\\matplotlibrc'
1.4.3 matplotlib.rcParams을 통한 동적 설정 변경
- matplotlib의 설정 정보는 matplotlib.rcParams에 저장되어 있으며, rcParams는 사전(Dict) 타입니다.
- rcParams 변경을 통해 동적으로 설정이 변경가능하며, 변경 즉시 반영된다.
matplotlib.rcParams
RcParams({'_internal.classic_mode': False,
          'agg.path.chunksize': 0,
          'animation.avconv_args': [],
          'animation.avconv_path': 'avconv',
          'animation.bitrate': -1,
          'animation.codec': 'h264',
          'animation.convert_args': [],
          'animation.convert_path': 'convert',
          'animation.embed_limit': 20.0,
          'animation.ffmpeg_args': [],
          'animation.ffmpeg_path': 'ffmpeg',
          'animation.frame_format': 'png',
          'animation.html': 'none',
          'animation.html_args': [],
          'animation.writer': 'ffmpeg',
          'axes.autolimit_mode': 'data',
          'axes.axisbelow': True,
          'axes.edgecolor': 'white',
          'axes.facecolor': '#EAEAF2',
          'axes.formatter.limits': [-5, 6],
          'axes.formatter.min_exponent': 0,
          'axes.formatter.offset_threshold': 4,
          'axes.formatter.use_locale': False,
          'axes.formatter.use_mathtext': False,
          'axes.formatter.useoffset': True,
          'axes.grid': True,
          'axes.grid.axis': 'both',
          'axes.grid.which': 'major',
          'axes.labelcolor': '.15',
          'axes.labelpad': 4.0,
          'axes.labelsize': 11.0,
          'axes.labelweight': 'normal',
          'axes.linewidth': 0.0,
          'axes.prop_cycle': cycler('color', ['#4C72B0', '#55A868', '#C44E52', '#8172B2', '#CCB974', '#64B5CD']),
          'axes.spines.bottom': True,
          'axes.spines.left': True,
          'axes.spines.right': True,
          'axes.spines.top': True,
          'axes.titlecolor': 'auto',
          'axes.titlelocation': 'center',
          'axes.titlepad': 6.0,
          'axes.titlesize': 12.0,
          'axes.titleweight': 'normal',
          'axes.unicode_minus': True,
          'axes.xmargin': 0.05,
          'axes.ymargin': 0.05,
          'axes3d.grid': True,
          'backend': 'module://ipykernel.pylab.backend_inline',
          'backend_fallback': True,
          'boxplot.bootstrap': None,
          'boxplot.boxprops.color': 'black',
          'boxplot.boxprops.linestyle': '-',
          'boxplot.boxprops.linewidth': 1.0,
          'boxplot.capprops.color': 'black',
          'boxplot.capprops.linestyle': '-',
          'boxplot.capprops.linewidth': 1.0,
          'boxplot.flierprops.color': 'black',
          'boxplot.flierprops.linestyle': 'none',
          'boxplot.flierprops.linewidth': 1.0,
          'boxplot.flierprops.marker': 'o',
          'boxplot.flierprops.markeredgecolor': 'black',
          'boxplot.flierprops.markeredgewidth': 1.0,
          'boxplot.flierprops.markerfacecolor': 'none',
          'boxplot.flierprops.markersize': 6.0,
          'boxplot.meanline': False,
          'boxplot.meanprops.color': 'C2',
          'boxplot.meanprops.linestyle': '--',
          'boxplot.meanprops.linewidth': 1.0,
          'boxplot.meanprops.marker': '^',
          'boxplot.meanprops.markeredgecolor': 'C2',
          'boxplot.meanprops.markerfacecolor': 'C2',
          'boxplot.meanprops.markersize': 6.0,
          'boxplot.medianprops.color': 'C1',
          'boxplot.medianprops.linestyle': '-',
          'boxplot.medianprops.linewidth': 1.0,
          'boxplot.notch': False,
          'boxplot.patchartist': False,
          'boxplot.showbox': True,
          'boxplot.showcaps': True,
          'boxplot.showfliers': True,
          'boxplot.showmeans': False,
          'boxplot.vertical': True,
          'boxplot.whiskerprops.color': 'black',
          'boxplot.whiskerprops.linestyle': '-',
          'boxplot.whiskerprops.linewidth': 1.0,
          'boxplot.whiskers': 1.5,
          'contour.corner_mask': True,
          'contour.negative_linestyle': 'dashed',
          'datapath': 'C:\\Users\\chom5\\anaconda3\\lib\\site-packages\\matplotlib\\mpl-data',
          'date.autoformatter.day': '%Y-%m-%d',
          'date.autoformatter.hour': '%m-%d %H',
          'date.autoformatter.microsecond': '%M:%S.%f',
          'date.autoformatter.minute': '%d %H:%M',
          'date.autoformatter.month': '%Y-%m',
          'date.autoformatter.second': '%H:%M:%S',
          'date.autoformatter.year': '%Y',
          'docstring.hardcopy': False,
          'errorbar.capsize': 0.0,
          'figure.autolayout': False,
          'figure.constrained_layout.h_pad': 0.04167,
          'figure.constrained_layout.hspace': 0.02,
          'figure.constrained_layout.use': False,
          'figure.constrained_layout.w_pad': 0.04167,
          'figure.constrained_layout.wspace': 0.02,
          'figure.dpi': 72.0,
          'figure.edgecolor': '0.50',
          'figure.facecolor': 'white',
          'figure.figsize': [8.0, 5.5],
          'figure.frameon': True,
          'figure.max_open_warning': 20,
          'figure.subplot.bottom': 0.125,
          'figure.subplot.hspace': 0.2,
          'figure.subplot.left': 0.125,
          'figure.subplot.right': 0.9,
          'figure.subplot.top': 0.88,
          'figure.subplot.wspace': 0.2,
          'figure.titlesize': 'large',
          'figure.titleweight': 'normal',
          'font.cursive': ['Apple Chancery',
                           'Textile',
                           'Zapf Chancery',
                           'Sand',
                           'Script MT',
                           'Felipa',
                           'cursive'],
          'font.family': ['sans-serif'],
          'font.fantasy': ['Comic Neue',
                           'Comic Sans MS',
                           'Chicago',
                           'Charcoal',
                           'Impact',
                           'Western',
                           'Humor Sans',
                           'xkcd',
                           'fantasy'],
          'font.monospace': ['DejaVu Sans Mono',
                             'Bitstream Vera Sans Mono',
                             'Computer Modern Typewriter',
                             'Andale Mono',
                             'Nimbus Mono L',
                             'Courier New',
                             'Courier',
                             'Fixed',
                             'Terminal',
                             'monospace'],
          'font.sans-serif': ['Arial',
                              'Liberation Sans',
                              'DejaVu Sans',
                              'Bitstream Vera Sans',
                              'sans-serif'],
          'font.serif': ['DejaVu Serif',
                         'Bitstream Vera Serif',
                         'Computer Modern Roman',
                         'New Century Schoolbook',
                         'Century Schoolbook L',
                         'Utopia',
                         'ITC Bookman',
                         'Bookman',
                         'Nimbus Roman No9 L',
                         'Times New Roman',
                         'Times',
                         'Palatino',
                         'Charter',
                         'serif'],
          'font.size': 10.0,
          'font.stretch': 'normal',
          'font.style': 'normal',
          'font.variant': 'normal',
          'font.weight': 'normal',
          'grid.alpha': 1.0,
          'grid.color': 'white',
          'grid.linestyle': '-',
          'grid.linewidth': 1.0,
          'hatch.color': 'black',
          'hatch.linewidth': 1.0,
          'hist.bins': 10,
          'image.aspect': 'equal',
          'image.cmap': 'Greys',
          'image.composite_image': True,
          'image.interpolation': 'antialiased',
          'image.lut': 256,
          'image.origin': 'upper',
          'image.resample': True,
          'interactive': True,
          'keymap.all_axes': ['a'],
          'keymap.back': ['left', 'c', 'backspace', 'MouseButton.BACK'],
          'keymap.copy': ['ctrl+c', 'cmd+c'],
          'keymap.forward': ['right', 'v', 'MouseButton.FORWARD'],
          'keymap.fullscreen': ['f', 'ctrl+f'],
          'keymap.grid': ['g'],
          'keymap.grid_minor': ['G'],
          'keymap.help': ['f1'],
          'keymap.home': ['h', 'r', 'home'],
          'keymap.pan': ['p'],
          'keymap.quit': ['ctrl+w', 'cmd+w', 'q'],
          'keymap.quit_all': ['W', 'cmd+W', 'Q'],
          'keymap.save': ['s', 'ctrl+s'],
          'keymap.xscale': ['k', 'L'],
          'keymap.yscale': ['l'],
          'keymap.zoom': ['o'],
          'legend.borderaxespad': 0.5,
          'legend.borderpad': 0.4,
          'legend.columnspacing': 2.0,
          'legend.edgecolor': '0.8',
          'legend.facecolor': 'inherit',
          'legend.fancybox': True,
          'legend.fontsize': 10.0,
          'legend.framealpha': 0.8,
          'legend.frameon': False,
          'legend.handleheight': 0.7,
          'legend.handlelength': 2.0,
          'legend.handletextpad': 0.8,
          'legend.labelspacing': 0.5,
          'legend.loc': 'best',
          'legend.markerscale': 1.0,
          'legend.numpoints': 1,
          'legend.scatterpoints': 1,
          'legend.shadow': False,
          'legend.title_fontsize': None,
          'lines.antialiased': True,
          'lines.color': 'C0',
          'lines.dash_capstyle': 'butt',
          'lines.dash_joinstyle': 'round',
          'lines.dashdot_pattern': [6.4, 1.6, 1.0, 1.6],
          'lines.dashed_pattern': [3.7, 1.6],
          'lines.dotted_pattern': [1.0, 1.65],
          'lines.linestyle': '-',
          'lines.linewidth': 1.75,
          'lines.marker': 'None',
          'lines.markeredgecolor': 'auto',
          'lines.markeredgewidth': 0.0,
          'lines.markerfacecolor': 'auto',
          'lines.markersize': 7.0,
          'lines.scale_dashes': True,
          'lines.solid_capstyle': 'round',
          'lines.solid_joinstyle': 'round',
          'markers.fillstyle': 'full',
          'mathtext.bf': 'sans:bold',
          'mathtext.cal': 'cursive',
          'mathtext.default': 'it',
          'mathtext.fallback_to_cm': True,
          'mathtext.fontset': 'dejavusans',
          'mathtext.it': 'sans:italic',
          'mathtext.rm': 'sans',
          'mathtext.sf': 'sans',
          'mathtext.tt': 'monospace',
          'mpl_toolkits.legacy_colorbar': True,
          'patch.antialiased': True,
          'patch.edgecolor': '#EEEEEE',
          'patch.facecolor': '#4C72B0',
          'patch.force_edgecolor': False,
          'patch.linewidth': 0.3,
          'path.effects': [],
          'path.simplify': True,
          'path.simplify_threshold': 0.1111111111111111,
          'path.sketch': None,
          'path.snap': True,
          'pdf.compression': 6,
          'pdf.fonttype': 3,
          'pdf.inheritcolor': False,
          'pdf.use14corefonts': False,
          'pgf.preamble': '',
          'pgf.rcfonts': True,
          'pgf.texsystem': 'xelatex',
          'polaraxes.grid': True,
          'ps.distiller.res': 6000,
          'ps.fonttype': 3,
          'ps.papersize': 'letter',
          'ps.useafm': False,
          'ps.usedistiller': None,
          'savefig.bbox': None,
          'savefig.directory': '~',
          'savefig.dpi': 'figure',
          'savefig.edgecolor': 'white',
          'savefig.facecolor': 'white',
          'savefig.format': 'png',
          'savefig.frameon': True,
          'savefig.jpeg_quality': 95,
          'savefig.orientation': 'portrait',
          'savefig.pad_inches': 0.1,
          'savefig.transparent': False,
          'scatter.edgecolors': 'face',
          'scatter.marker': 'o',
          'svg.fonttype': 'path',
          'svg.hashsalt': None,
          'svg.image_inline': True,
          'text.antialiased': True,
          'text.color': '.15',
          'text.hinting': 'auto',
          'text.hinting_factor': 8,
          'text.kerning_factor': 0,
          'text.latex.preamble': '',
          'text.latex.preview': False,
          'text.latex.unicode': True,
          'text.usetex': False,
          'timezone': 'UTC',
          'tk.window_focus': False,
          'toolbar': 'toolbar2',
          'verbose.fileo': 'sys.stdout',
          'verbose.level': 'silent',
          'webagg.address': '127.0.0.1',
          'webagg.open_in_browser': True,
          'webagg.port': 8988,
          'webagg.port_retries': 50,
          'xtick.alignment': 'center',
          'xtick.bottom': True,
          'xtick.color': '.15',
          'xtick.direction': 'out',
          'xtick.labelbottom': True,
          'xtick.labelsize': 10.0,
          'xtick.labeltop': False,
          'xtick.major.bottom': True,
          'xtick.major.pad': 7.0,
          'xtick.major.size': 0.0,
          'xtick.major.top': True,
          'xtick.major.width': 1.0,
          'xtick.minor.bottom': True,
          'xtick.minor.pad': 3.4,
          'xtick.minor.size': 0.0,
          'xtick.minor.top': True,
          'xtick.minor.visible': False,
          'xtick.minor.width': 0.5,
          'xtick.top': False,
          'ytick.alignment': 'center_baseline',
          'ytick.color': '.15',
          'ytick.direction': 'out',
          'ytick.labelleft': True,
          'ytick.labelright': False,
          'ytick.labelsize': 10.0,
          'ytick.left': True,
          'ytick.major.left': True,
          'ytick.major.pad': 7.0,
          'ytick.major.right': True,
          'ytick.major.size': 0.0,
          'ytick.major.width': 1.0,
          'ytick.minor.left': True,
          'ytick.minor.pad': 3.4,
          'ytick.minor.right': True,
          'ytick.minor.size': 0.0,
          'ytick.minor.visible': False,
          'ytick.minor.width': 0.5,
          'ytick.right': False})
matplotlib.rcParams['font.family'] = 'Malgun Gothic'
# Mac의 경우 AppleGothic
sr3 = Series([10, 20, 30], index = ['가','나','다'])
plt.plot(sr3)
[<matplotlib.lines.Line2D at 0x1915df79c40>]
.png)
2. <a href=https://pandas.pydata.org/pandas-docs/stable/generated/pandas.DataFrame.plot.html>Pandas의 plot() 함수를 통한 시각화</a>
- pandas의 대표적인 데이터타입인 Series와 DataFrame은 plot() 함수를 제공하며 이를 통해 여러 차트를 그릴 수 있다.
- 내부적으로는 Series.plot()과 DataFrame.plot() 모두 matplotlib를 사용하며, 파라미터 인자에 따라 적절한 함수가 호출된다.
- matplotlib은 plot()은 line graph, bar()는 bar graph, hist()는 히스토그램 등 차트의 종류에 따라 다른 함수를 호출해야 하지만, pandas는 차트의 종류에 상관 없이, 차트를 그리는 함수는 plot()이며, kind 인자를 통해 차트의 종류를 설정할 수 있다.
- matplotlib의 함수들을 직접 사용하는 것보다 사용자 친화적인 인터페이스를 제공하지만, matplotlib의 모든 기능을 제공하지는 않으므로 약간의 불편함은 존재한다.
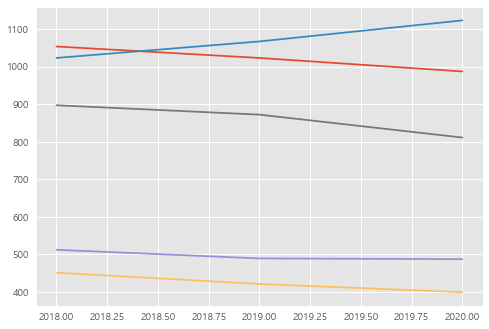
인구통계 = {'서울': [1053.5, 1023, 987],
        '경기':[1023, 1067, 1123],
        '충청':[512,489,487],
        '경상':[897, 872, 811],
        '전라':[451, 421, 399]
      }
df = DataFrame(인구통계)
df.index = [2018, 2019, 2020]
기본 그리기 - <a href= https://matplotlib.org/api/_as_gen/matplotlib.lines.Line2D.html#matplotlib.lines.Line2D>line graph</a>
df.plot()
<matplotlib.axes._subplots.AxesSubplot at 0x1915de63910>
.png)
plt.plot(df)
[<matplotlib.lines.Line2D at 0x1915f850e20>,
 <matplotlib.lines.Line2D at 0x1915f850f10>,
 <matplotlib.lines.Line2D at 0x1915f850fd0>,
 <matplotlib.lines.Line2D at 0x1915f85d0d0>,
 <matplotlib.lines.Line2D at 0x1915f85d190>]
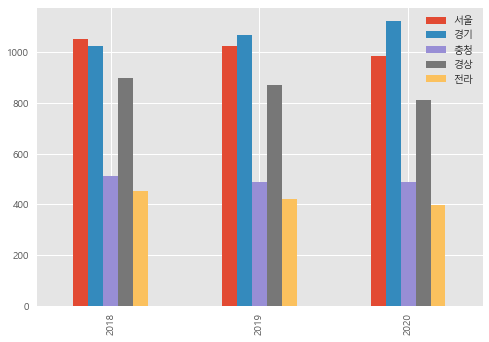
matplotlib.style.use('ggplot')
df.plot(kind='bar')
<matplotlib.axes._subplots.AxesSubplot at 0x1915f7a07f0>
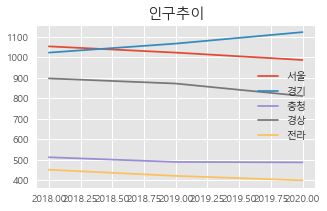
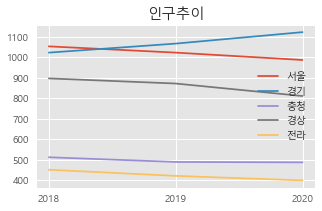
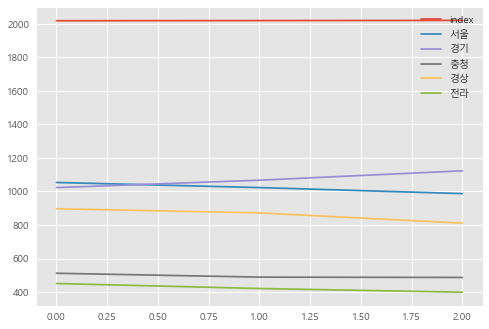
df.plot(kind='line',
       title='인구추이',
       figsize=(5,3))
<matplotlib.axes._subplots.AxesSubplot at 0x1915f89e5e0>
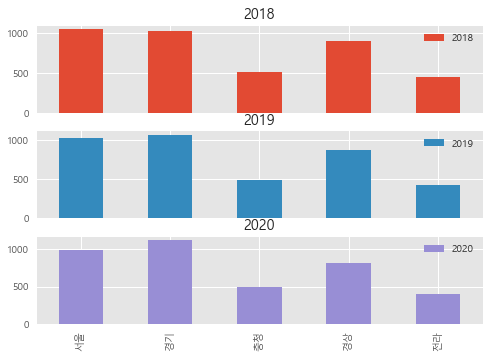
df.plot(kind='line',
       title='인구추이',
       figsize=(5,10),
       subplots=True)
array([<matplotlib.axes._subplots.AxesSubplot object at 0x000001915F99ACA0>,
       <matplotlib.axes._subplots.AxesSubplot object at 0x000001915F9C2820>,
       <matplotlib.axes._subplots.AxesSubplot object at 0x000001915F9E3A60>,
       <matplotlib.axes._subplots.AxesSubplot object at 0x000001915FA12C10>,
       <matplotlib.axes._subplots.AxesSubplot object at 0x000001915FA41D90>],
      dtype=object)
.png)
df.plot(kind='line',
       title='인구추이',
       figsize=(5,3),
       subplots=False,
       xticks=[2018, 2019, 2020])
<matplotlib.axes._subplots.AxesSubplot at 0x1915fb432e0>

df.plot(kind='line',
       title='인구추이',
       figsize=(5,3),
       subplots=False,
       xticks=df.index)
<matplotlib.axes._subplots.AxesSubplot at 0x1915f8997f0>
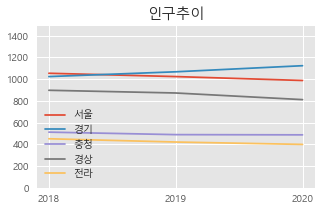
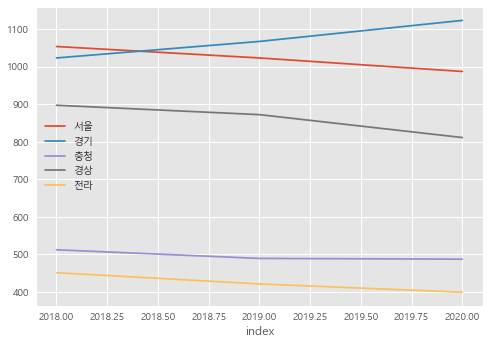
df.plot(kind='line',
       title='인구추이',
       figsize=(5,3),
       subplots=False,
       xticks=df.index,
       ylim=[0, 1500])
<matplotlib.axes._subplots.AxesSubplot at 0x1915f817a90>
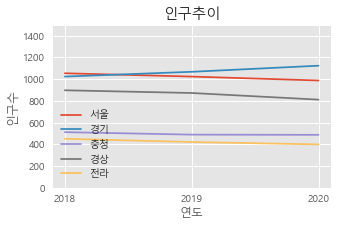
df.plot(kind='line',
       title='인구추이',
       figsize=(5,3),
       subplots=False,
       xticks=df.index,
       ylim=[0, 1500],
       xlabel='연도',
       ylabel='인구수')
<matplotlib.axes._subplots.AxesSubplot at 0x1915fd35370>
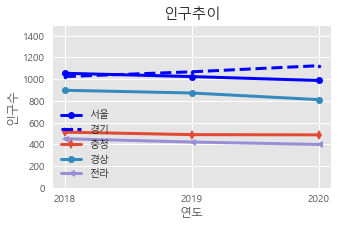
df.plot(kind='line',
       title='인구추이',
       figsize=(5,3),
       subplots=False,
       xticks=df.index,
       ylim=[0, 1500],
       xlabel='연도',
       ylabel='인구수',
       style=['bo-','b.--','d-','o-','<-'],
       lw=3)
<matplotlib.axes._subplots.AxesSubplot at 0x19160d808e0>

색상: https://matplotlib.org/examples/color/named_colors.html
기타 스타일: https://matplotlib.org/api/_as_gen/matplotlib.lines.Line2D.html#matplotlib.lines.Line2D
# 실습. 연도별 지역별 인구수 그래프 그리기
df.T.plot(kind='bar')
<matplotlib.axes._subplots.AxesSubplot at 0x19160fd8340>
.png)
df.T.plot(kind='bar', subplots=True)
array([<matplotlib.axes._subplots.AxesSubplot object at 0x0000019160FDE4C0>,
       <matplotlib.axes._subplots.AxesSubplot object at 0x000001916108C3A0>,
       <matplotlib.axes._subplots.AxesSubplot object at 0x00000191610A9A30>],
      dtype=object)
df2=df.reset_index()
df2
| index | 서울 | 경기 | 충청 | 경상 | 전라 | |
|---|---|---|---|---|---|---|
| 0 | 2018 | 1053.5 | 1023 | 512 | 897 | 451 |
| 1 | 2019 | 1023.0 | 1067 | 489 | 872 | 421 |
| 2 | 2020 | 987.0 | 1123 | 487 | 811 | 399 |
df2.plot()
<matplotlib.axes._subplots.AxesSubplot at 0x19161168490>
df2.plot(x='index',y=['서울','경기','충청','경상','전라'])
<matplotlib.axes._subplots.AxesSubplot at 0x19161205940>
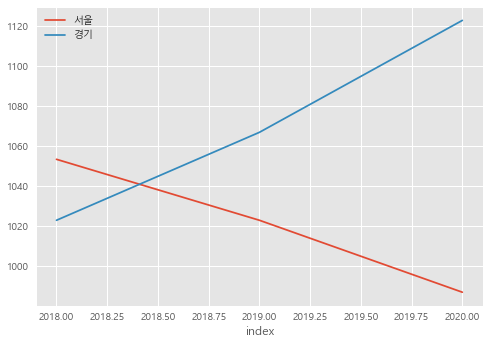
df2.plot(x='index',y=['서울','경기'])
<matplotlib.axes._subplots.AxesSubplot at 0x1916127dfd0>
3. 왕좌의 게임 데이터 분석 및 시각화 실습
1) 데이터 적재
- battless.csv : 전투의 이름, 발생년도, 공격/수비 정보(가문, 왕, 군대 규모 등)을 저장
- deaths.csv : 캐릭터들의 이름, 성별 등 기본 정보와 사망 정보
battles = pd.read_csv('data/data-society-game-of-thrones/battles.csv')
death = pd.read_csv('data/data-society-game-of-thrones/character-deaths.csv')
battles.head(3)
| name | year | battle_number | attacker_king | defender_king | attacker_1 | attacker_2 | attacker_3 | attacker_4 | defender_1 | ... | major_death | major_capture | attacker_size | defender_size | attacker_commander | defender_commander | summer | location | region | note | |
|---|---|---|---|---|---|---|---|---|---|---|---|---|---|---|---|---|---|---|---|---|---|
| 0 | Battle of the Golden Tooth | 298 | 1 | Joffrey/Tommen Baratheon | Robb Stark | Lannister | NaN | NaN | NaN | Tully | ... | 1.0 | 0.0 | 15000.0 | 4000.0 | Jaime Lannister | Clement Piper, Vance | 1.0 | Golden Tooth | The Westerlands | NaN |
| 1 | Battle at the Mummer's Ford | 298 | 2 | Joffrey/Tommen Baratheon | Robb Stark | Lannister | NaN | NaN | NaN | Baratheon | ... | 1.0 | 0.0 | NaN | 120.0 | Gregor Clegane | Beric Dondarrion | 1.0 | Mummer's Ford | The Riverlands | NaN |
| 2 | Battle of Riverrun | 298 | 3 | Joffrey/Tommen Baratheon | Robb Stark | Lannister | NaN | NaN | NaN | Tully | ... | 0.0 | 1.0 | 15000.0 | 10000.0 | Jaime Lannister, Andros Brax | Edmure Tully, Tytos Blackwood | 1.0 | Riverrun | The Riverlands | NaN |
3 rows × 25 columns
death.head(3)
| Name | Allegiances | Death Year | Book of Death | Death Chapter | Book Intro Chapter | Gender | Nobility | GoT | CoK | SoS | FfC | DwD | |
|---|---|---|---|---|---|---|---|---|---|---|---|---|---|
| 0 | Addam Marbrand | Lannister | NaN | NaN | NaN | 56.0 | 1 | 1 | 1 | 1 | 1 | 1 | 0 |
| 1 | Aegon Frey (Jinglebell) | None | 299.0 | 3.0 | 51.0 | 49.0 | 1 | 1 | 0 | 0 | 1 | 0 | 0 |
| 2 | Aegon Targaryen | House Targaryen | NaN | NaN | NaN | 5.0 | 1 | 1 | 0 | 0 | 0 | 0 | 1 |
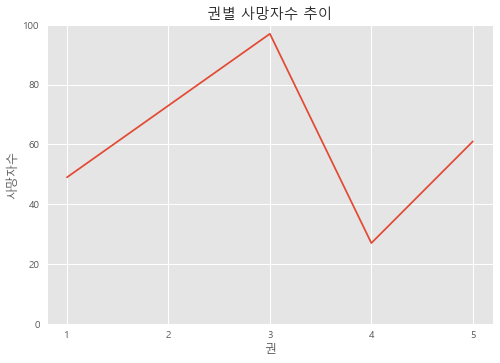
2) 책의 권(Book of Death)별로 사망자 수 추이 시각화
death['Book of Death']
0      NaN
1      3.0
2      NaN
3      5.0
4      NaN
      ...
912    NaN
913    5.0
914    5.0
915    5.0
916    4.0
Name: Book of Death, Length: 917, dtype: float64
death['Book of Death'].value_counts()
3.0    97
2.0    73
5.0    61
1.0    49
4.0    27
Name: Book of Death, dtype: int64
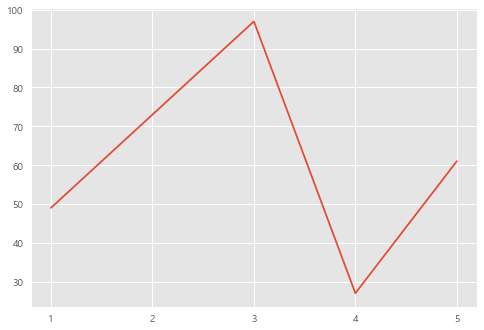
bookofdeath = death['Book of Death'].value_counts().sort_index()
bookofdeath.plot()
<matplotlib.axes._subplots.AxesSubplot at 0x191621646a0>
.png)
bookofdeath.plot(xticks=bookofdeath.index)
<matplotlib.axes._subplots.AxesSubplot at 0x191621ddfa0>
bookofdeath.plot(xticks=bookofdeath.index,
                ylim=[0,100],
                xlabel='권',
                ylabel='사망자수',
                title='권별 사망자수 추이')
<matplotlib.axes._subplots.AxesSubplot at 0x19162225370>

axes = bookofdeath.plot(xticks=bookofdeath.index,
                ylim=[0,100],
                xlabel='권',
                ylabel='사망자수',
                title='권별 사망자수 추이')
axes.figure.savefig('test.jpg')
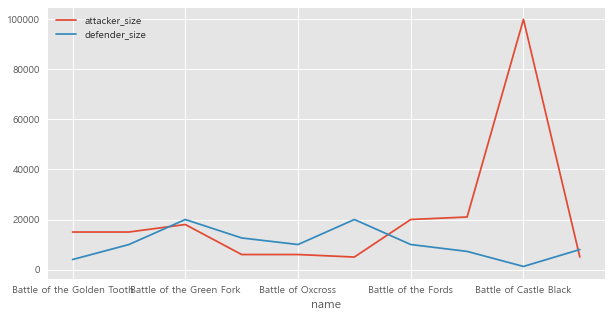
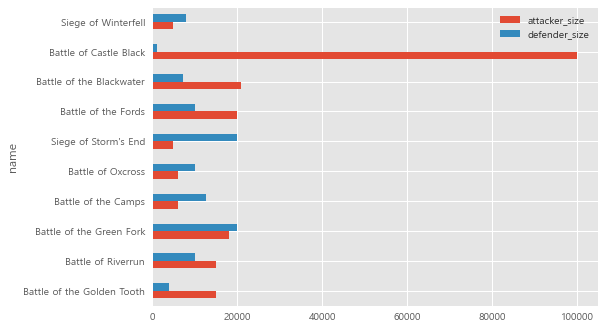
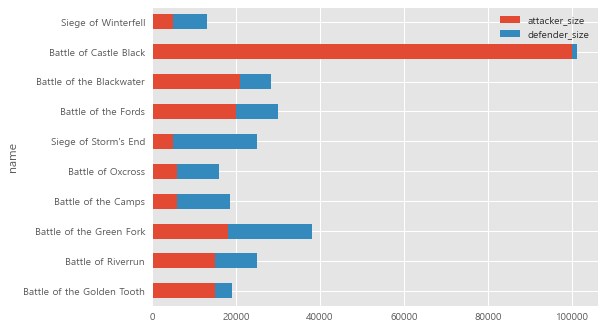
3) 대규모 전투의 공격진영과 수비 진영의 숫자 시각화
대규모 전투 = 공격과 수비 모두 합쳐서 10,000명 이상 참가한 전쟁
battles[['attacker_size','defender_size']]
| attacker_size | defender_size | |
|---|---|---|
| 0 | 15000.0 | 4000.0 |
| 1 | NaN | 120.0 |
| 2 | 15000.0 | 10000.0 |
| 3 | 18000.0 | 20000.0 |
| 4 | 1875.0 | 6000.0 |
| 5 | 6000.0 | 12625.0 |
| 6 | NaN | NaN |
| 7 | NaN | NaN |
| 8 | 1000.0 | NaN |
| 9 | 264.0 | NaN |
| 10 | 244.0 | 900.0 |
| 11 | 20.0 | NaN |
| 12 | NaN | NaN |
| 13 | 618.0 | 2000.0 |
| 14 | 6000.0 | 10000.0 |
| 15 | 5000.0 | 20000.0 |
| 16 | 20000.0 | 10000.0 |
| 17 | 100.0 | 100.0 |
| 18 | 6000.0 | NaN |
| 19 | 21000.0 | 7250.0 |
| 20 | NaN | NaN |
| 21 | 3000.0 | NaN |
| 22 | NaN | NaN |
| 23 | NaN | 6000.0 |
| 24 | NaN | NaN |
| 25 | 3500.0 | 3500.0 |
| 26 | NaN | NaN |
| 27 | 100000.0 | 1240.0 |
| 28 | NaN | NaN |
| 29 | NaN | NaN |
| 30 | 4500.0 | 200.0 |
| 31 | NaN | NaN |
| 32 | NaN | NaN |
| 33 | NaN | 200.0 |
| 34 | 2000.0 | NaN |
| 35 | 3000.0 | NaN |
| 36 | 1500.0 | NaN |
| 37 | 5000.0 | 8000.0 |
battles['total_size']=battles['attacker_size']+battles['defender_size']
df3 = battles[battles['total_size']>=10000]
df3
| name | year | battle_number | attacker_king | defender_king | attacker_1 | attacker_2 | attacker_3 | attacker_4 | defender_1 | ... | major_capture | attacker_size | defender_size | attacker_commander | defender_commander | summer | location | region | note | total_size | |
|---|---|---|---|---|---|---|---|---|---|---|---|---|---|---|---|---|---|---|---|---|---|
| 0 | Battle of the Golden Tooth | 298 | 1 | Joffrey/Tommen Baratheon | Robb Stark | Lannister | NaN | NaN | NaN | Tully | ... | 0.0 | 15000.0 | 4000.0 | Jaime Lannister | Clement Piper, Vance | 1.0 | Golden Tooth | The Westerlands | NaN | 19000.0 |
| 2 | Battle of Riverrun | 298 | 3 | Joffrey/Tommen Baratheon | Robb Stark | Lannister | NaN | NaN | NaN | Tully | ... | 1.0 | 15000.0 | 10000.0 | Jaime Lannister, Andros Brax | Edmure Tully, Tytos Blackwood | 1.0 | Riverrun | The Riverlands | NaN | 25000.0 |
| 3 | Battle of the Green Fork | 298 | 4 | Robb Stark | Joffrey/Tommen Baratheon | Stark | NaN | NaN | NaN | Lannister | ... | 1.0 | 18000.0 | 20000.0 | Roose Bolton, Wylis Manderly, Medger Cerwyn, H... | Tywin Lannister, Gregor Clegane, Kevan Lannist... | 1.0 | Green Fork | The Riverlands | NaN | 38000.0 |
| 5 | Battle of the Camps | 298 | 6 | Robb Stark | Joffrey/Tommen Baratheon | Stark | Tully | NaN | NaN | Lannister | ... | 0.0 | 6000.0 | 12625.0 | Robb Stark, Tytos Blackwood, Brynden Tully | Lord Andros Brax, Forley Prester | 1.0 | Riverrun | The Riverlands | NaN | 18625.0 |
| 14 | Battle of Oxcross | 299 | 15 | Robb Stark | Joffrey/Tommen Baratheon | Stark | Tully | NaN | NaN | Lannister | ... | 1.0 | 6000.0 | 10000.0 | Robb Stark, Brynden Tully | Stafford Lannister, Roland Crakehall, Antario ... | 1.0 | Oxcross | The Westerlands | NaN | 16000.0 |
| 15 | Siege of Storm's End | 299 | 16 | Stannis Baratheon | Renly Baratheon | Baratheon | NaN | NaN | NaN | Baratheon | ... | 0.0 | 5000.0 | 20000.0 | Stannis Baratheon, Davos Seaworth | Renly Baratheon, Cortnay Penrose, Loras Tyrell... | 1.0 | Storm's End | The Stormlands | NaN | 25000.0 |
| 16 | Battle of the Fords | 299 | 17 | Joffrey/Tommen Baratheon | Robb Stark | Lannister | NaN | NaN | NaN | Tully | ... | 0.0 | 20000.0 | 10000.0 | Tywin Lannister, Flement Brax, Gregor Clegane,... | Edmure Tully, Jason Mallister, Karyl Vance | 1.0 | Red Fork | The Riverlands | NaN | 30000.0 |
| 19 | Battle of the Blackwater | 299 | 20 | Stannis Baratheon | Joffrey/Tommen Baratheon | Baratheon | NaN | NaN | NaN | Lannister | ... | 1.0 | 21000.0 | 7250.0 | Stannis Baratheon, Imry Florent, Guyard Morrig... | Tyrion Lannister, Jacelyn Bywater, Sandor Cleg... | 1.0 | King's Landing | The Crownlands | NaN | 28250.0 |
| 27 | Battle of Castle Black | 300 | 28 | Stannis Baratheon | Mance Rayder | Free folk | Thenns | Giants | NaN | Night's Watch | ... | 1.0 | 100000.0 | 1240.0 | Mance Rayder, Tormund Giantsbane, Harma Dogshe... | Stannis Baratheon, Jon Snow, Donal Noye, Cotte... | 0.0 | Castle Black | Beyond the Wall | NaN | 101240.0 |
| 37 | Siege of Winterfell | 300 | 38 | Stannis Baratheon | Joffrey/Tommen Baratheon | Baratheon | Karstark | Mormont | Glover | Bolton | ... | NaN | 5000.0 | 8000.0 | Stannis Baratheon | Roose Bolton | 0.0 | Winterfell | The North | NaN | 13000.0 |
10 rows × 26 columns
df3.plot(x='name',y=['attacker_size','defender_size'],figsize=(10,5))
<matplotlib.axes._subplots.AxesSubplot at 0x191650b2af0>
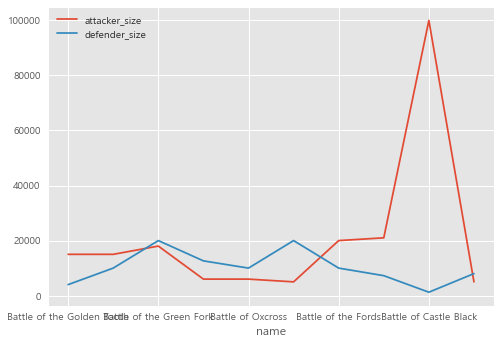
big_battles = battles[battles.attacker_size + battles.defender_size >= 10000]
big_battles.plot(x='name',y=['attacker_size','defender_size'])
<matplotlib.axes._subplots.AxesSubplot at 0x19164f2f910>
big_battles.plot(x='name',y=['attacker_size','defender_size'],
                kind='barh')
<matplotlib.axes._subplots.AxesSubplot at 0x19164f8ce50>
big_battles.plot(x='name',y=['attacker_size','defender_size'],
                kind='barh', stacked=True)
<matplotlib.axes._subplots.AxesSubplot at 0x19165024bb0>
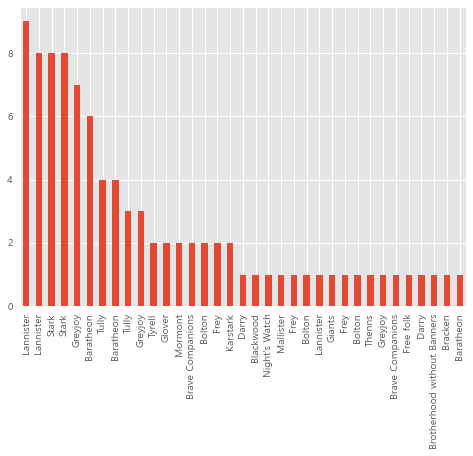
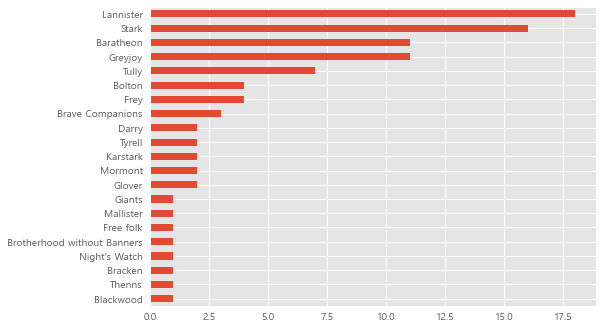
4) (실습 #1) 가문 별로 전쟁을 참여한 횟수 시각화
attack1 = battles['attacker_1'].value_counts()
attack1
Lannister                      8
Stark                          8
Greyjoy                        7
Baratheon                      6
Bolton                         2
Frey                           2
Bracken                        1
Brotherhood without Banners    1
Darry                          1
Free folk                      1
Brave Companions               1
Name: attacker_1, dtype: int64
attack2 = battles['attacker_2'].value_counts()
attack3 = battles['attacker_3'].value_counts()
attack4 = battles['attacker_4'].value_counts()
attack=pd.concat([attack1,attack2,attack3,attack4])
defend1 = battles['defender_1'].value_counts()
defend1
Lannister           9
Stark               8
Baratheon           4
Tully               4
Greyjoy             3
Brave Companions    2
Tyrell              2
Bolton              1
Darry               1
Blackwood           1
Night's Watch       1
Mallister           1
Name: defender_1, dtype: int64
defend2 = battles['defender_2'].value_counts()
defend3 = battles['defender_3'].value_counts()
defend4 = battles['defender_4'].value_counts()
defend=pd.concat([defend1,defend2,defend3,defend4])
atdf = pd.concat([attack,defend], axis=0)
atdf = atdf.sort_values(ascending=False)
atdf.plot(kind='bar')
<matplotlib.axes._subplots.AxesSubplot at 0x19165413640>
battles.columns
Index(['name', 'year', 'battle_number', 'attacker_king', 'defender_king',
       'attacker_1', 'attacker_2', 'attacker_3', 'attacker_4', 'defender_1',
       'defender_2', 'defender_3', 'defender_4', 'attacker_outcome',
       'battle_type', 'major_death', 'major_capture', 'attacker_size',
       'defender_size', 'attacker_commander', 'defender_commander', 'summer',
       'location', 'region', 'note', 'total_size'],
      dtype='object')
battles.head(2)
| name | year | battle_number | attacker_king | defender_king | attacker_1 | attacker_2 | attacker_3 | attacker_4 | defender_1 | ... | major_capture | attacker_size | defender_size | attacker_commander | defender_commander | summer | location | region | note | total_size | |
|---|---|---|---|---|---|---|---|---|---|---|---|---|---|---|---|---|---|---|---|---|---|
| 0 | Battle of the Golden Tooth | 298 | 1 | Joffrey/Tommen Baratheon | Robb Stark | Lannister | NaN | NaN | NaN | Tully | ... | 0.0 | 15000.0 | 4000.0 | Jaime Lannister | Clement Piper, Vance | 1.0 | Golden Tooth | The Westerlands | NaN | 19000.0 |
| 1 | Battle at the Mummer's Ford | 298 | 2 | Joffrey/Tommen Baratheon | Robb Stark | Lannister | NaN | NaN | NaN | Baratheon | ... | 0.0 | NaN | 120.0 | Gregor Clegane | Beric Dondarrion | 1.0 | Mummer's Ford | The Riverlands | NaN | NaN |
2 rows × 26 columns
#1. 필요한 컬럼 추출 (attacker_1 ~ defender_4)
battles[['attacker_1','attacker_2','attacker_3','attacker_4','defender_1','defender_2','defender_3','defender_4']]
| attacker_1 | attacker_2 | attacker_3 | attacker_4 | defender_1 | defender_2 | defender_3 | defender_4 | |
|---|---|---|---|---|---|---|---|---|
| 0 | Lannister | NaN | NaN | NaN | Tully | NaN | NaN | NaN |
| 1 | Lannister | NaN | NaN | NaN | Baratheon | NaN | NaN | NaN |
| 2 | Lannister | NaN | NaN | NaN | Tully | NaN | NaN | NaN |
| 3 | Stark | NaN | NaN | NaN | Lannister | NaN | NaN | NaN |
| 4 | Stark | Tully | NaN | NaN | Lannister | NaN | NaN | NaN |
| 5 | Stark | Tully | NaN | NaN | Lannister | NaN | NaN | NaN |
| 6 | Lannister | NaN | NaN | NaN | Darry | NaN | NaN | NaN |
| 7 | Greyjoy | NaN | NaN | NaN | Stark | NaN | NaN | NaN |
| 8 | Greyjoy | NaN | NaN | NaN | Stark | NaN | NaN | NaN |
| 9 | Greyjoy | NaN | NaN | NaN | Stark | NaN | NaN | NaN |
| 10 | Stark | NaN | NaN | NaN | Greyjoy | NaN | NaN | NaN |
| 11 | Greyjoy | NaN | NaN | NaN | Stark | NaN | NaN | NaN |
| 12 | Greyjoy | NaN | NaN | NaN | Stark | NaN | NaN | NaN |
| 13 | Bolton | Greyjoy | NaN | NaN | Stark | NaN | NaN | NaN |
| 14 | Stark | Tully | NaN | NaN | Lannister | NaN | NaN | NaN |
| 15 | Baratheon | NaN | NaN | NaN | Baratheon | NaN | NaN | NaN |
| 16 | Lannister | NaN | NaN | NaN | Tully | NaN | NaN | NaN |
| 17 | Stark | NaN | NaN | NaN | Lannister | NaN | NaN | NaN |
| 18 | Stark | NaN | NaN | NaN | Lannister | NaN | NaN | NaN |
| 19 | Baratheon | NaN | NaN | NaN | Lannister | NaN | NaN | NaN |
| 20 | Darry | NaN | NaN | NaN | Lannister | NaN | NaN | NaN |
| 21 | Stark | NaN | NaN | NaN | Lannister | NaN | NaN | NaN |
| 22 | Brotherhood without Banners | NaN | NaN | NaN | Brave Companions | NaN | NaN | NaN |
| 23 | Lannister | NaN | NaN | NaN | Stark | NaN | NaN | NaN |
| 24 | Lannister | NaN | NaN | NaN | Brave Companions | NaN | NaN | NaN |
| 25 | Frey | Bolton | NaN | NaN | Stark | NaN | NaN | NaN |
| 26 | Frey | NaN | NaN | NaN | Mallister | NaN | NaN | NaN |
| 27 | Free folk | Thenns | Giants | NaN | Night's Watch | Baratheon | NaN | NaN |
| 28 | Bolton | NaN | NaN | NaN | Greyjoy | NaN | NaN | NaN |
| 29 | Brave Companions | NaN | NaN | NaN | NaN | NaN | NaN | NaN |
| 30 | Baratheon | Karstark | Mormont | Glover | Greyjoy | NaN | NaN | NaN |
| 31 | Greyjoy | NaN | NaN | NaN | Tyrell | NaN | NaN | NaN |
| 32 | Greyjoy | NaN | NaN | NaN | Tyrell | NaN | NaN | NaN |
| 33 | Baratheon | NaN | NaN | NaN | Baratheon | NaN | NaN | NaN |
| 34 | Baratheon | NaN | NaN | NaN | Baratheon | NaN | NaN | NaN |
| 35 | Lannister | Frey | NaN | NaN | Tully | NaN | NaN | NaN |
| 36 | Bracken | Lannister | NaN | NaN | Blackwood | NaN | NaN | NaN |
| 37 | Baratheon | Karstark | Mormont | Glover | Bolton | Frey | NaN | NaN |
battles.loc[:, 'attacker_1':'defender_4']
| attacker_1 | attacker_2 | attacker_3 | attacker_4 | defender_1 | defender_2 | defender_3 | defender_4 | |
|---|---|---|---|---|---|---|---|---|
| 0 | Lannister | NaN | NaN | NaN | Tully | NaN | NaN | NaN |
| 1 | Lannister | NaN | NaN | NaN | Baratheon | NaN | NaN | NaN |
| 2 | Lannister | NaN | NaN | NaN | Tully | NaN | NaN | NaN |
| 3 | Stark | NaN | NaN | NaN | Lannister | NaN | NaN | NaN |
| 4 | Stark | Tully | NaN | NaN | Lannister | NaN | NaN | NaN |
| 5 | Stark | Tully | NaN | NaN | Lannister | NaN | NaN | NaN |
| 6 | Lannister | NaN | NaN | NaN | Darry | NaN | NaN | NaN |
| 7 | Greyjoy | NaN | NaN | NaN | Stark | NaN | NaN | NaN |
| 8 | Greyjoy | NaN | NaN | NaN | Stark | NaN | NaN | NaN |
| 9 | Greyjoy | NaN | NaN | NaN | Stark | NaN | NaN | NaN |
| 10 | Stark | NaN | NaN | NaN | Greyjoy | NaN | NaN | NaN |
| 11 | Greyjoy | NaN | NaN | NaN | Stark | NaN | NaN | NaN |
| 12 | Greyjoy | NaN | NaN | NaN | Stark | NaN | NaN | NaN |
| 13 | Bolton | Greyjoy | NaN | NaN | Stark | NaN | NaN | NaN |
| 14 | Stark | Tully | NaN | NaN | Lannister | NaN | NaN | NaN |
| 15 | Baratheon | NaN | NaN | NaN | Baratheon | NaN | NaN | NaN |
| 16 | Lannister | NaN | NaN | NaN | Tully | NaN | NaN | NaN |
| 17 | Stark | NaN | NaN | NaN | Lannister | NaN | NaN | NaN |
| 18 | Stark | NaN | NaN | NaN | Lannister | NaN | NaN | NaN |
| 19 | Baratheon | NaN | NaN | NaN | Lannister | NaN | NaN | NaN |
| 20 | Darry | NaN | NaN | NaN | Lannister | NaN | NaN | NaN |
| 21 | Stark | NaN | NaN | NaN | Lannister | NaN | NaN | NaN |
| 22 | Brotherhood without Banners | NaN | NaN | NaN | Brave Companions | NaN | NaN | NaN |
| 23 | Lannister | NaN | NaN | NaN | Stark | NaN | NaN | NaN |
| 24 | Lannister | NaN | NaN | NaN | Brave Companions | NaN | NaN | NaN |
| 25 | Frey | Bolton | NaN | NaN | Stark | NaN | NaN | NaN |
| 26 | Frey | NaN | NaN | NaN | Mallister | NaN | NaN | NaN |
| 27 | Free folk | Thenns | Giants | NaN | Night's Watch | Baratheon | NaN | NaN |
| 28 | Bolton | NaN | NaN | NaN | Greyjoy | NaN | NaN | NaN |
| 29 | Brave Companions | NaN | NaN | NaN | NaN | NaN | NaN | NaN |
| 30 | Baratheon | Karstark | Mormont | Glover | Greyjoy | NaN | NaN | NaN |
| 31 | Greyjoy | NaN | NaN | NaN | Tyrell | NaN | NaN | NaN |
| 32 | Greyjoy | NaN | NaN | NaN | Tyrell | NaN | NaN | NaN |
| 33 | Baratheon | NaN | NaN | NaN | Baratheon | NaN | NaN | NaN |
| 34 | Baratheon | NaN | NaN | NaN | Baratheon | NaN | NaN | NaN |
| 35 | Lannister | Frey | NaN | NaN | Tully | NaN | NaN | NaN |
| 36 | Bracken | Lannister | NaN | NaN | Blackwood | NaN | NaN | NaN |
| 37 | Baratheon | Karstark | Mormont | Glover | Bolton | Frey | NaN | NaN |
battles.filter(regex='attacker_[1-4]|defender_[1-4]', axis=1)
| attacker_1 | attacker_2 | attacker_3 | attacker_4 | defender_1 | defender_2 | defender_3 | defender_4 | |
|---|---|---|---|---|---|---|---|---|
| 0 | Lannister | NaN | NaN | NaN | Tully | NaN | NaN | NaN |
| 1 | Lannister | NaN | NaN | NaN | Baratheon | NaN | NaN | NaN |
| 2 | Lannister | NaN | NaN | NaN | Tully | NaN | NaN | NaN |
| 3 | Stark | NaN | NaN | NaN | Lannister | NaN | NaN | NaN |
| 4 | Stark | Tully | NaN | NaN | Lannister | NaN | NaN | NaN |
| 5 | Stark | Tully | NaN | NaN | Lannister | NaN | NaN | NaN |
| 6 | Lannister | NaN | NaN | NaN | Darry | NaN | NaN | NaN |
| 7 | Greyjoy | NaN | NaN | NaN | Stark | NaN | NaN | NaN |
| 8 | Greyjoy | NaN | NaN | NaN | Stark | NaN | NaN | NaN |
| 9 | Greyjoy | NaN | NaN | NaN | Stark | NaN | NaN | NaN |
| 10 | Stark | NaN | NaN | NaN | Greyjoy | NaN | NaN | NaN |
| 11 | Greyjoy | NaN | NaN | NaN | Stark | NaN | NaN | NaN |
| 12 | Greyjoy | NaN | NaN | NaN | Stark | NaN | NaN | NaN |
| 13 | Bolton | Greyjoy | NaN | NaN | Stark | NaN | NaN | NaN |
| 14 | Stark | Tully | NaN | NaN | Lannister | NaN | NaN | NaN |
| 15 | Baratheon | NaN | NaN | NaN | Baratheon | NaN | NaN | NaN |
| 16 | Lannister | NaN | NaN | NaN | Tully | NaN | NaN | NaN |
| 17 | Stark | NaN | NaN | NaN | Lannister | NaN | NaN | NaN |
| 18 | Stark | NaN | NaN | NaN | Lannister | NaN | NaN | NaN |
| 19 | Baratheon | NaN | NaN | NaN | Lannister | NaN | NaN | NaN |
| 20 | Darry | NaN | NaN | NaN | Lannister | NaN | NaN | NaN |
| 21 | Stark | NaN | NaN | NaN | Lannister | NaN | NaN | NaN |
| 22 | Brotherhood without Banners | NaN | NaN | NaN | Brave Companions | NaN | NaN | NaN |
| 23 | Lannister | NaN | NaN | NaN | Stark | NaN | NaN | NaN |
| 24 | Lannister | NaN | NaN | NaN | Brave Companions | NaN | NaN | NaN |
| 25 | Frey | Bolton | NaN | NaN | Stark | NaN | NaN | NaN |
| 26 | Frey | NaN | NaN | NaN | Mallister | NaN | NaN | NaN |
| 27 | Free folk | Thenns | Giants | NaN | Night's Watch | Baratheon | NaN | NaN |
| 28 | Bolton | NaN | NaN | NaN | Greyjoy | NaN | NaN | NaN |
| 29 | Brave Companions | NaN | NaN | NaN | NaN | NaN | NaN | NaN |
| 30 | Baratheon | Karstark | Mormont | Glover | Greyjoy | NaN | NaN | NaN |
| 31 | Greyjoy | NaN | NaN | NaN | Tyrell | NaN | NaN | NaN |
| 32 | Greyjoy | NaN | NaN | NaN | Tyrell | NaN | NaN | NaN |
| 33 | Baratheon | NaN | NaN | NaN | Baratheon | NaN | NaN | NaN |
| 34 | Baratheon | NaN | NaN | NaN | Baratheon | NaN | NaN | NaN |
| 35 | Lannister | Frey | NaN | NaN | Tully | NaN | NaN | NaN |
| 36 | Bracken | Lannister | NaN | NaN | Blackwood | NaN | NaN | NaN |
| 37 | Baratheon | Karstark | Mormont | Glover | Bolton | Frey | NaN | NaN |
ex1 = battles.filter(regex='attacker_[1-4]|defender_[1-4]', axis=1)
ex1.attacker_1.value_counts()
Lannister                      8
Stark                          8
Greyjoy                        7
Baratheon                      6
Bolton                         2
Frey                           2
Bracken                        1
Brotherhood without Banners    1
Darry                          1
Free folk                      1
Brave Companions               1
Name: attacker_1, dtype: int64
전쟁가문 = Series()
for col in ex1.columns:
    전쟁가문=전쟁가문.add(ex1[col].value_counts(),fill_value=0)
<ipython-input-193-18ffa5178853>:1: DeprecationWarning: The default dtype for empty Series will be 'object' instead of 'float64' in a future version. Specify a dtype explicitly to silence this warning.
  전쟁가문 = Series()
전쟁가문
Baratheon                      11.0
Blackwood                       1.0
Bolton                          4.0
Bracken                         1.0
Brave Companions                3.0
Brotherhood without Banners     1.0
Darry                           2.0
Free folk                       1.0
Frey                            4.0
Giants                          1.0
Glover                          2.0
Greyjoy                        11.0
Karstark                        2.0
Lannister                      18.0
Mallister                       1.0
Mormont                         2.0
Night's Watch                   1.0
Stark                          16.0
Thenns                          1.0
Tully                           7.0
Tyrell                          2.0
dtype: float64
전쟁가문.sort_values().plot(kind='barh')
<matplotlib.axes._subplots.AxesSubplot at 0x19165287250>
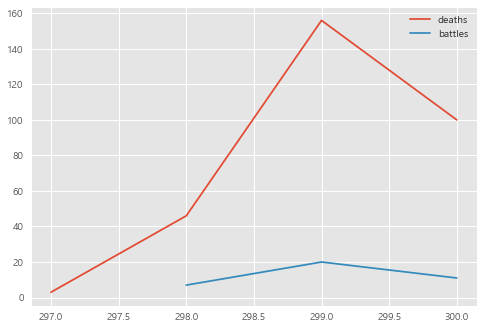
5) (실습 #2) 년도별로 사망자의 숫자와 전쟁이 벌어진 횟수 시각화
death['Death Year'].value_counts()
299.0    156
300.0    100
298.0     46
297.0      3
Name: Death Year, dtype: int64
battle_num = battles['year'].value_counts().sort_index()
deathbattle = pd.concat([deaths, battle_num], axis=1)
deathbattle.columns=['deaths','battles']
deathbattle.plot()
<matplotlib.axes._subplots.AxesSubplot at 0x19163ce68b0>
#1. 년도별로 사망자 수 추이 구하기
death_year = death['Death Year'].value_counts()
death_year
299.0    156
300.0    100
298.0     46
297.0      3
Name: Death Year, dtype: int64
death.pivot_table(index='Death Year', aggfunc='count', values='Name')
#values로 활용할 컬럼이 Nan 값이 없어야지만 정상적으로 집계
| Name | |
|---|---|
| Death Year | |
| 297.0 | 3 |
| 298.0 | 46 |
| 299.0 | 156 |
| 300.0 | 100 |
#2. 년도별로 전쟁 횟수 구하기
battle_year = battles.year.value_counts()
battle_year
299    20
300    11
298     7
Name: year, dtype: int64
death_battles_year = pd.concat([death_year, battle_year], axis=1)
death_battles_year.columns =['# of death', '# of battles']
death_battles_year.fillna(0, inplace=True)
death_battles_year.plot()
<matplotlib.axes._subplots.AxesSubplot at 0x19163ca3700>
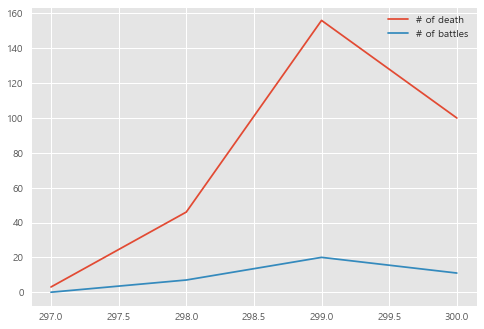
death_battles_year.corr()
| # of death | # of battles | |
|---|---|---|
| # of death | 1.00000 | 0.98991 |
| # of battles | 0.98991 | 1.00000 |